
Monitoring and Logs
Overview
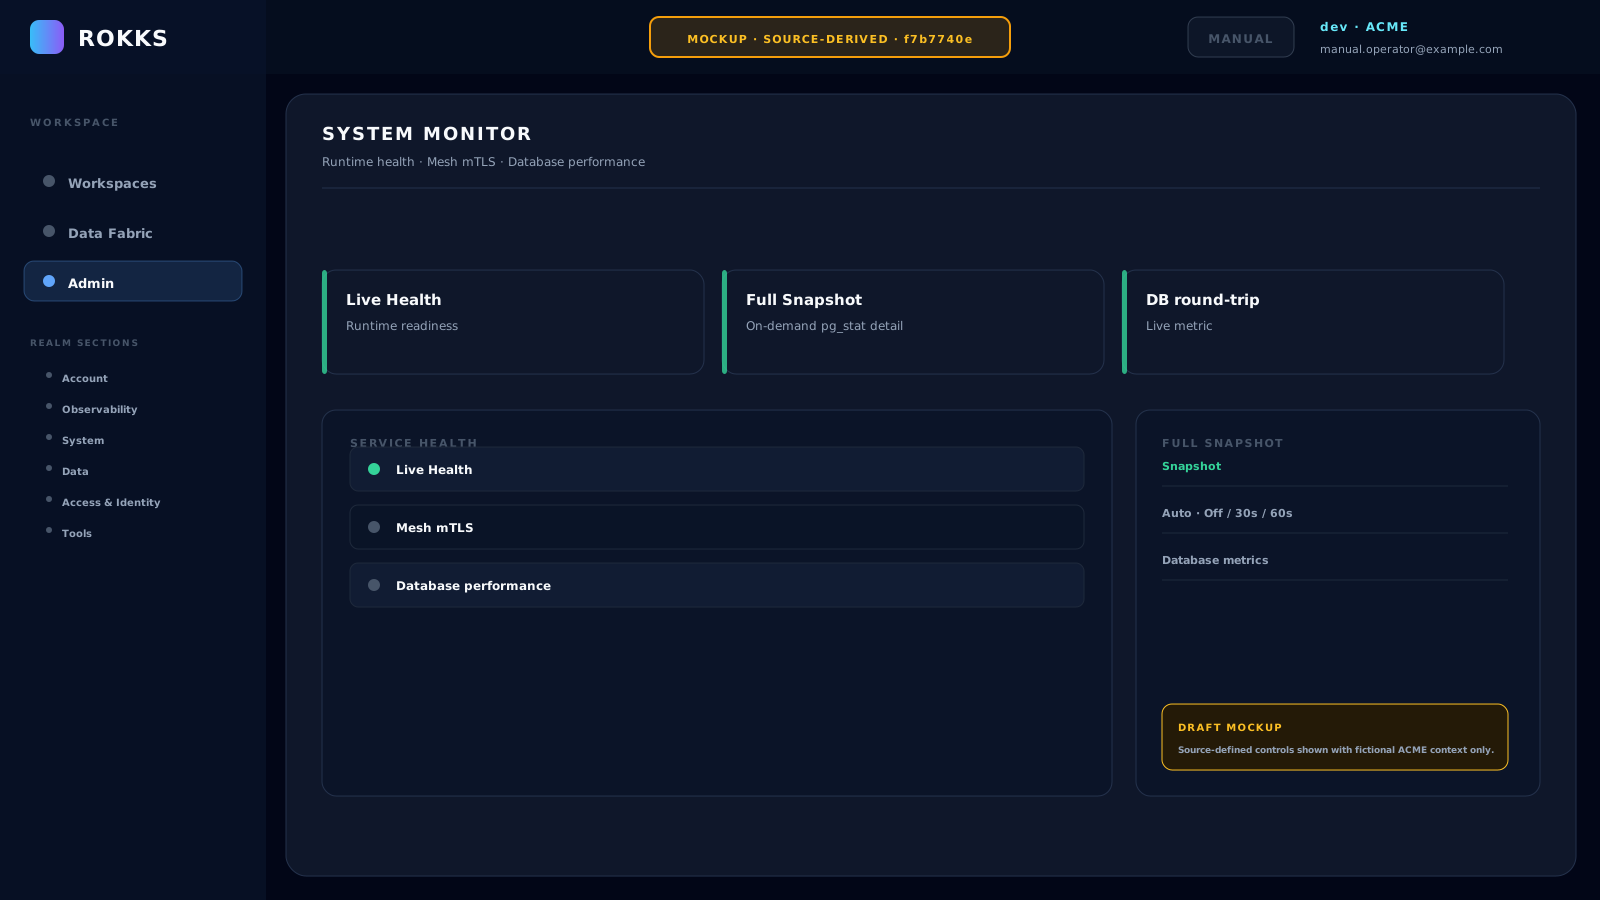
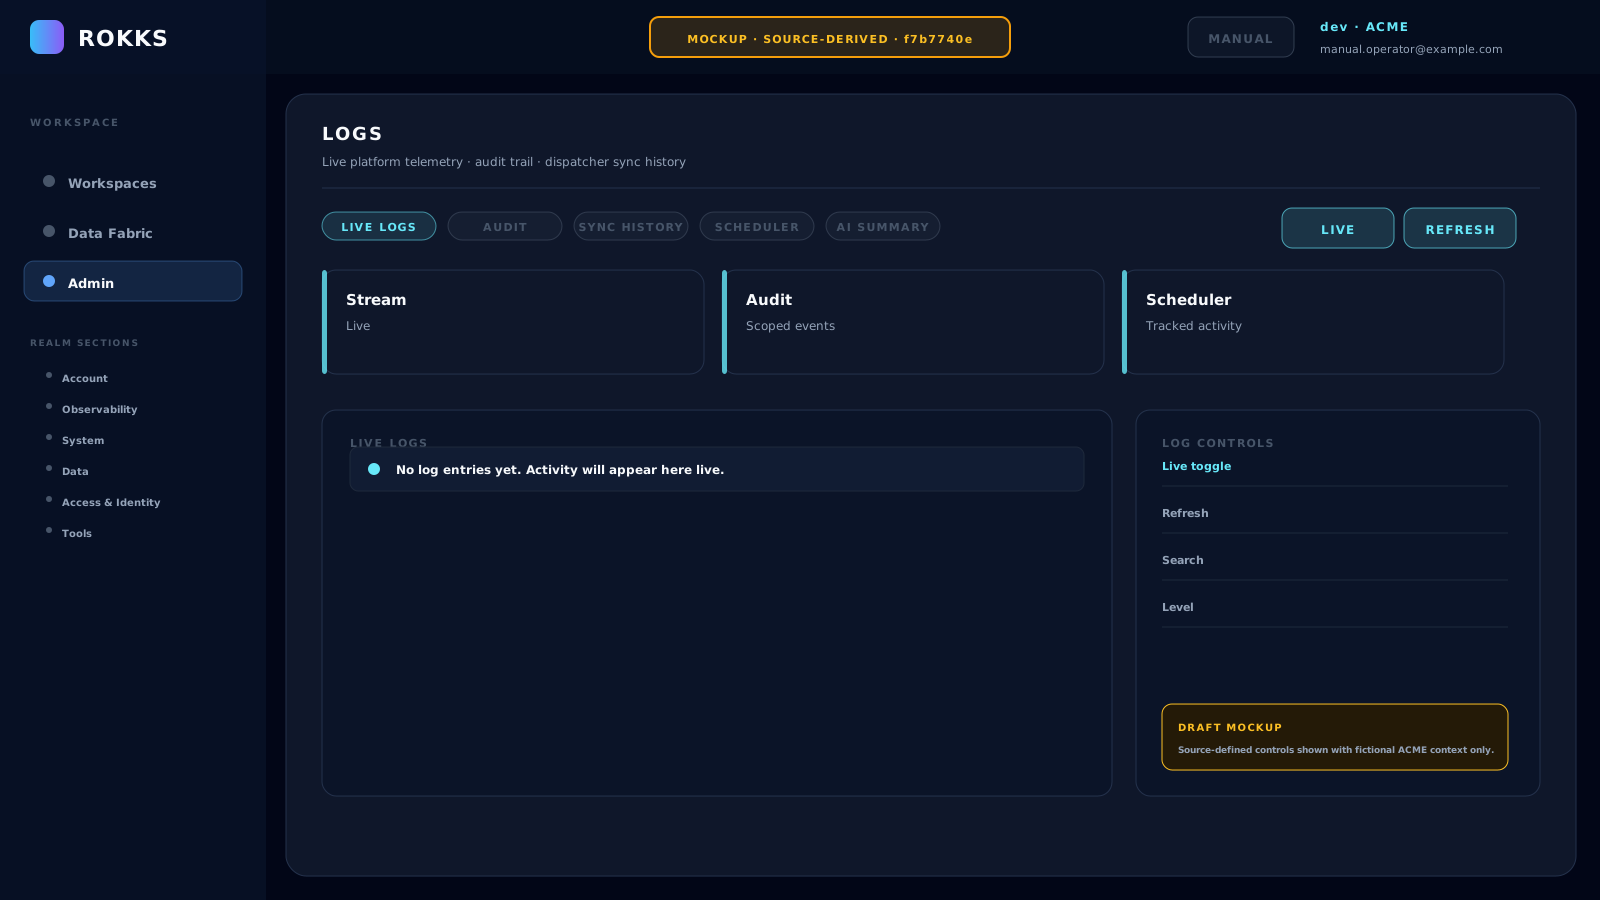
Section titled “Overview”Monitoring views show whether the platform is healthy and what recently happened. Use them when users report failures, stale data, slow jobs, or missing dashboards.
How it works
Section titled “How it works”Health checks show service readiness. Logs show operational events and errors. Job records show long-running work. Together they answer three questions: is the system reachable, did the requested work start, and where did it fail?
MOCKUPSource-derived illustration — not a captured product state
MOCKUPSource-derived illustration — not a captured product state
Step-by-step
Section titled “Step-by-step”- Start with the user-visible symptom.
- Check the Job Queue for related background work.
- Check monitoring for affected services.
- Review recent errors around the time of the issue.
- Fix the source problem or escalate with the job and error details.
Common mistakes
Section titled “Common mistakes”Do not troubleshoot from browser symptoms alone. Many user-visible errors are downstream service, job, or scope issues.
Do not treat a healthy service as proof the workflow succeeded. A service can be healthy while a specific job failed.