
Reports
Overview
Section titled “Overview”A report is a paginated, print-oriented document inside a workspace. Use reports when the output needs fixed page geometry, a narrative, repeatable page furniture, and a browser-generated PDF rather than an interactive dashboard canvas.
How it works
Section titled “How it works”Each report contains an ordered set of pages. A page can hold widget, text, image, and shape blocks positioned on a fixed sheet. Document settings define page size, orientation, margins, and optional repeating header and footer bands; an individual page can override its size and orientation.
The header’s ··· action menu contains Print, Add page, Compose, and Edit. Edit mode adds the block palette, page reordering, snapping, selection handles, and the Element/Page inspector. Changes auto-save when you finish editing.
The Document Composer has Overview, Brief, Data, and Settings areas. Linking a backing dashboard makes its widgets available through Link table. If that dashboard defines filter fields, the report header also offers a dataset selector whose selection applies across linked widgets on every page.
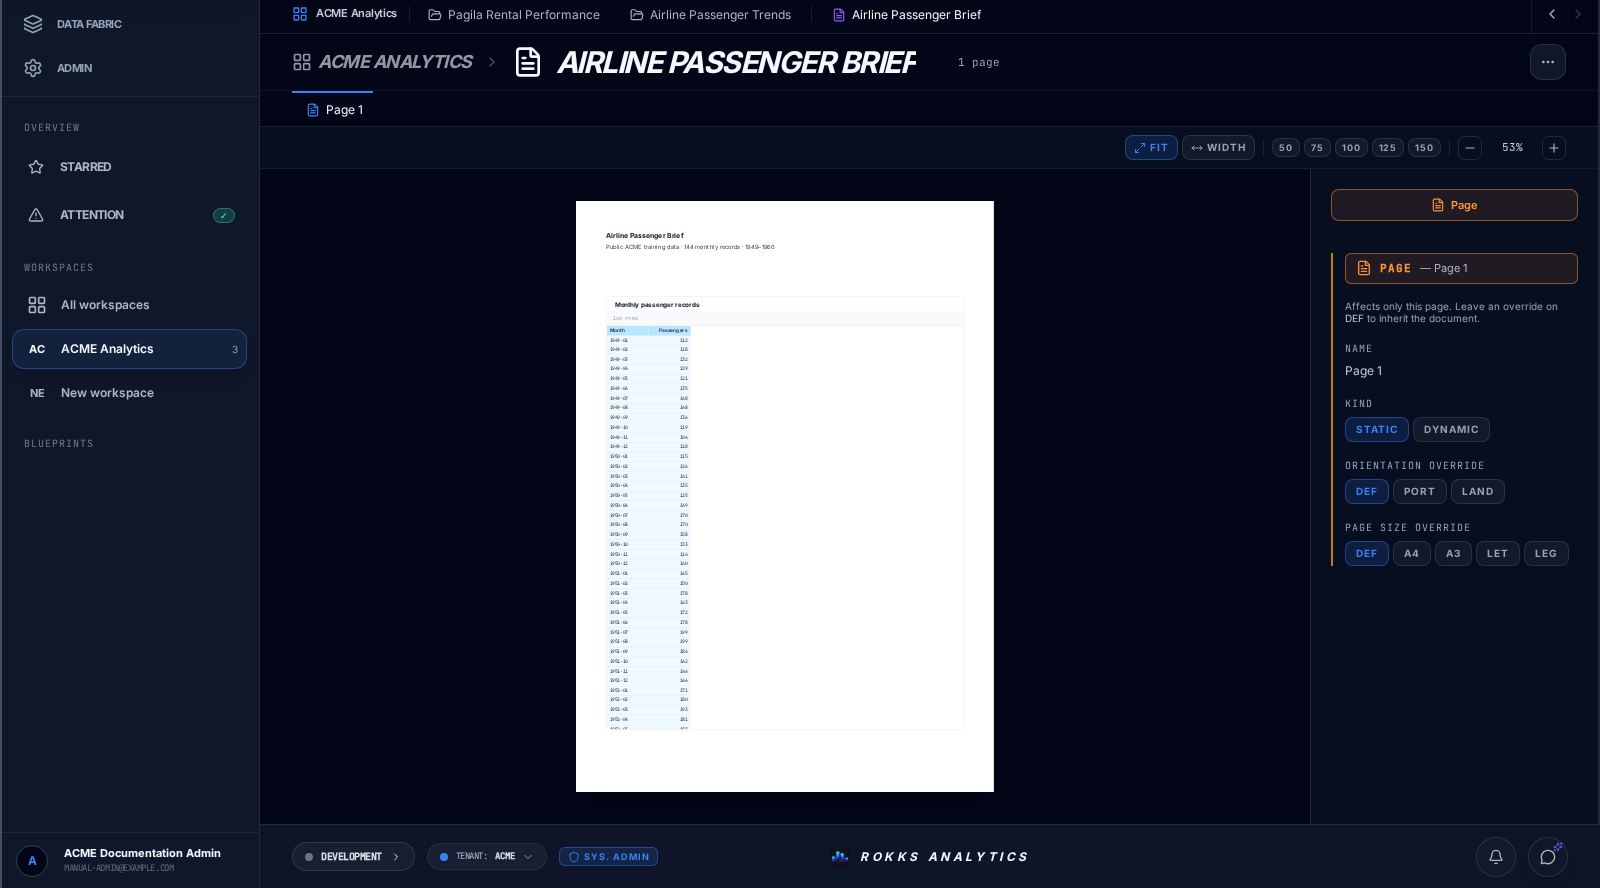
The real capture shows a one-page portrait report containing a text heading and a live-linked table. The table still belongs to the backing Airline Passenger Trends dashboard: report placement does not create a second data query or a detached copy.
Step-by-step
Section titled “Step-by-step”- Open a real workspace and find the Reports tier.
- Click New report. ROKKS creates the report in that workspace and opens it.
- Rename the report by selecting its title in the header.
- Open ···, choose Compose, and write a brief that describes the document’s purpose and structure.
- In Composer Settings, choose the page size, orientation, and margins. Add a header or footer only when the document needs a repeating band.
- In Composer Data, select a dashboard when the report should contain live-linked widgets.
- Close the Composer, open ···, and click Add page.
- Choose Edit. Arm Text, Image, Shape, or a widget block and click or drag on the sheet to place it. Use Link table to place a widget from the backing dashboard.
- Use the page tabs to switch pages. In edit mode, drag a page tab to reorder it.
- Finish editing, open ···, and choose Print. ROKKS prepares the complete report and opens the browser print dialog, where you can save it as a PDF.
Common mistakes
Section titled “Common mistakes”Do not look for a separate Save button. Report changes auto-save, and the active Edit control finishes layout editing.
Do not expect Link table before you link a backing dashboard that has widgets. Configure the source in Composer Data first.
Do not expect a dataset selector merely because a dashboard is linked. The linked dashboard must also define filterable fields.
Be careful with table presentation settings in the Element inspector. The rendered-row limit and column width or wrapping settings are saved on the backing dashboard widget, so they can affect its other placements.
Use the browser print dialog’s cancel control if you do not want to complete the PDF hand-off. Print is disabled until the report has at least one page.