
Pagila Maiden Flight
Complete one end-to-end ROKKS workflow with public fictional data: download the Pagila Rental Constellation JSON, load its six related tables through File Areas, verify the governed outputs, and create a relation-aware dashboard named Pagila Rental Performance in the ACME Analytics workspace.
This tutorial uses no customer data. The organization in examples is ACME, and any identity shown in an illustration uses the example.com domain.
Preflight check
Section titled “Preflight check”Confirm this preflight checklist before uploading the file:
- You are signed in to the intended environment and the ACME tenant selected for this exercise.
- Your role can create File Areas and dashboards.
- File operations are available. If ROKKS shows a service-offline banner, stop and ask an administrator to restore the service.
- The configured maximum upload size is at least 14 MB. The JSON is 14,316,401 bytes, so 15 MB or more leaves useful margin.
- You have enough time to let the upload, sample, transform plan, and load jobs finish. Do not close a modal while it reports an in-progress save.
- You understand whether Auto-Load Data and Proactive AI are on. Proactive AI can advance Sample → Plan; Auto-Load Data can advance Plan → Load. You can still open the Plan bead to review the mapping.
The source upload is stored as a blob, not as document metadata. The platform’s separately configured upload maximum is the relevant limit. If the upload is rejected as too large, ask an administrator to raise that configured maximum before continuing; do not split or truncate the canonical fixture.
Download the public Constellation fixture
Section titled “Download the public Constellation fixture”Download the primary source, its derivation record, and the common licence:
The Constellation JSON is 14,316,401 bytes and has this SHA-256 checksum:
83281cc7936bf37a8f9a232ab1f468b4b4fe5664edb6a01d5b176dcb00c7ae4aThe Pagila Rental Constellation is a reduced six-table relational projection, not the complete upstream Pagila database schema. It contains categories, stores, customers, films, rentals, and payments. Fact coverage is complete for this projection: all 51,805 rental facts and all 51,056 non-empty rental-level aggregate payment facts are present. A payment row represents the aggregate for one rental; it is not a copy of the upstream payment-table grain. The payment rows preserve the certified total revenue of 170,962.39 USD.
Deterministic derivation material
Section titled “Deterministic derivation material”The JSON was generated deterministically from the companion Pagila rental facts CSV. The CSV source and derivation record pins the public Pagila v4.0.0 inputs, the transformation contract, and this SHA-256 checksum:
0e7a033d85e4e5657e2fefd5e81f68c7c067de92a43e3dae4b96ad75aef4a2eeThe CSV is 11,138,814 bytes and contains 51,805 rental rows with 21 flattened columns. It remains the reproducible input to the JSON generator and the public sample for the separate CSV to Dashboard tutorial. It is not a second maiden-flight import path. Both public fixture files were derived only from the pinned Pagila release and contain no ROKKS customer or vault data.
Step 1: Create the Constellation and upload the JSON
Section titled “Step 1: Create the Constellation and upload the JSON”- Open Data Fabric, then File Areas.
- Click New in the File Areas rail.
- Replace the generated name with Pagila Samples.
- Open that area’s action menu and choose Add Constellation. Name the child Pagila Rental Constellation.
- Select the Constellation, choose Upload Source, and upload
pagila-rental-constellation.json. A Constellation accepts one JSON source. - Wait for sampling to finish, then choose Generate Plan.
Step 2: Review and save the six-table plan
Section titled “Step 2: Review and save the six-table plan”In Define Transformation, confirm that the overview contains exactly these six nodes and five relationships:
| Node | Primary key | Expected rows after loading |
|---|---|---|
categories |
category_name |
16 |
stores |
store_id |
2 |
customers |
customer_id |
997 |
films |
film_id |
958 |
rentals |
rental_id |
51,805 |
payments |
payment_id |
51,056 |
| From | To |
|---|---|
films.category_name |
categories.category_name |
rentals.store_id |
stores.store_id |
rentals.customer_id |
customers.customer_id |
rentals.film_id |
films.film_id |
payments.rental_id |
rentals.rental_id |
Check the field types, nullable dates, primary keys, and relationship endpoints. Do not run a plan with a missing node, an empty field list, a different key, or an incorrect edge. Choose Save Constellation when the plan matches the two tables above.
For the equivalent chat-driven workflow, follow the File Area and constellation cookbook. Keep the plan-review stop in the prompt so you can inspect the six nodes before starting the forward-only load.
Step 3: Run and verify every output
Section titled “Step 3: Run and verify every output”- Select Pagila Rental Constellation and choose Run.
- If your role exposes operational pages, open Admin → Job Queue, select Job History, and inspect the jobs for the Constellation. The
AREA_ETL_SYNCparent dispatches the childFILE_ETLload. AnAREA_ETL_SYNCparent reaching DONE proves dispatch, not the child load outcome. Require the childFILE_ETLjob to reach DONE; ERROR or CANCELLED is not a successful maiden flight. - Return to File Areas and require the Constellation to report 6/6 loaded.
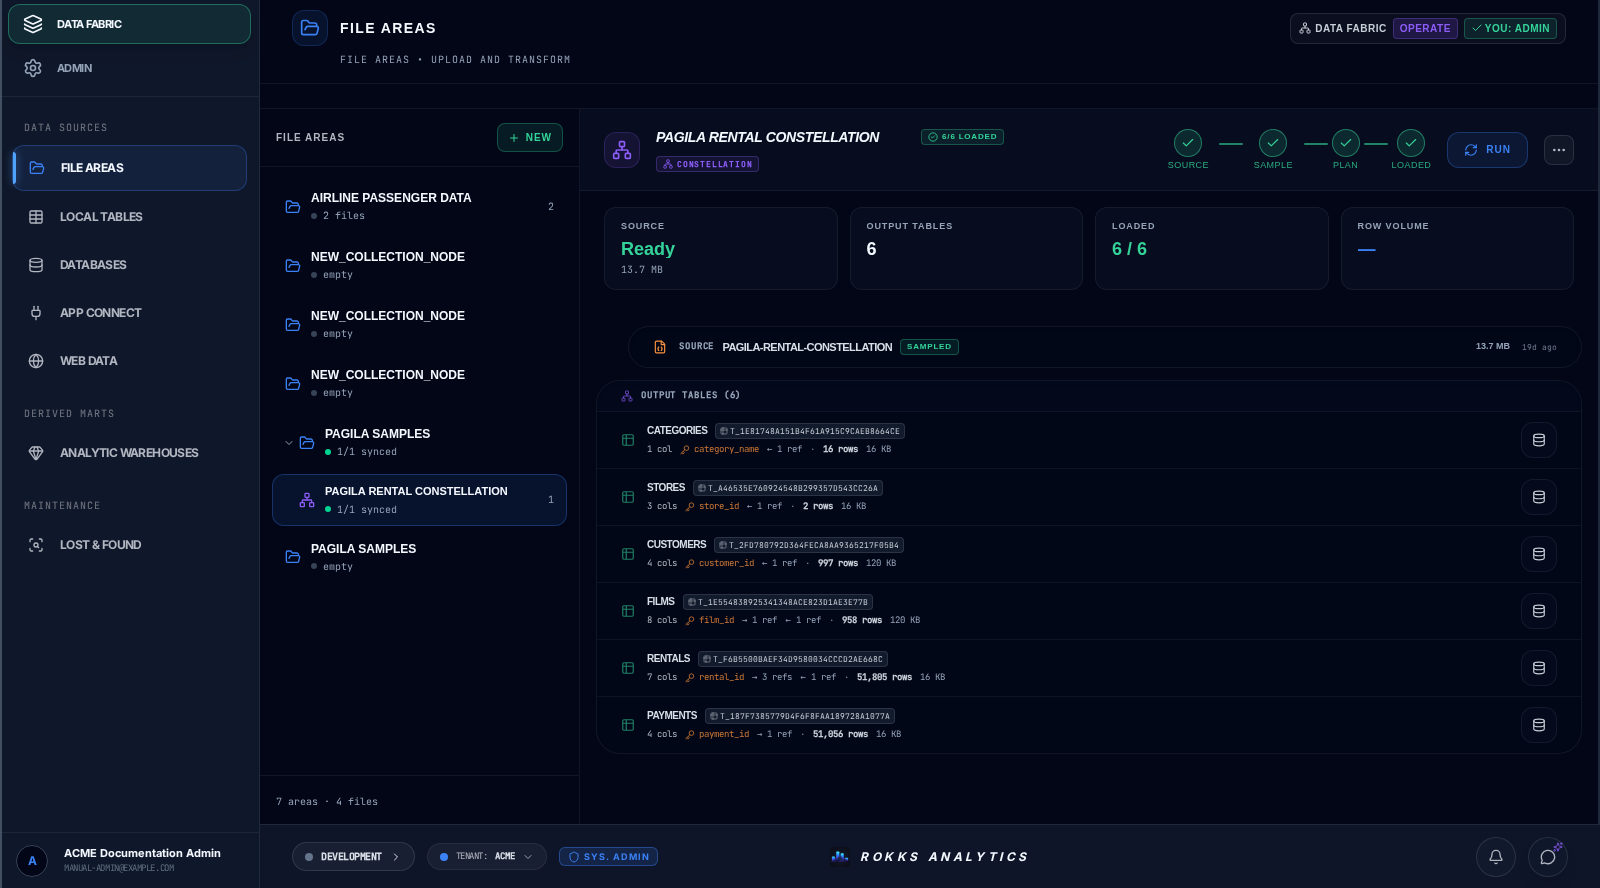
- In the Output tables list, confirm Categories 16, Stores 2, Customers 997, Films 958, Rentals 51,805, and Payments 51,056. Use each row’s Inspect action to review the governed table.
- Open Analytic Warehouse → Data Source Tables to find the same governed outputs, then open Relationship Map to review their connections. They do not appear under Local Tables.
The captured ACME constellation below passed this load checkpoint. All six table counts match the fixture; the child load job completed successfully. This is the reduced rental projection described above, not the complete upstream schema.
Step 4: Create the relation-aware dashboard
Section titled “Step 4: Create the relation-aware dashboard”- Open Workspaces, then enter or create ACME Analytics.
- Click New. If the workspace is empty, the equivalent action is Add dashboard.
- Hover the new dashboard title, click its pencil, and name it Pagila Rental Performance.
- On the empty-dashboard screen, choose Build it by hand, then click Start building.
- Click Add column. In the automatically created empty row, click Add or drag widget here to open Edit Widget.
Create the first widget as follows:
- Open Type and choose Line.
- Open Data Model and use the schema canvas. The canvas begins with Select a field on any table to start; there is no separate source dropdown. If it reports no data sources, add Pagila Samples under dashboard Settings → Data Context.
- Select the qualified fields
"payments"."amount"and"payments"."payment_date"; do not substitute similarly named unqualified fields. - Open Visualize and map
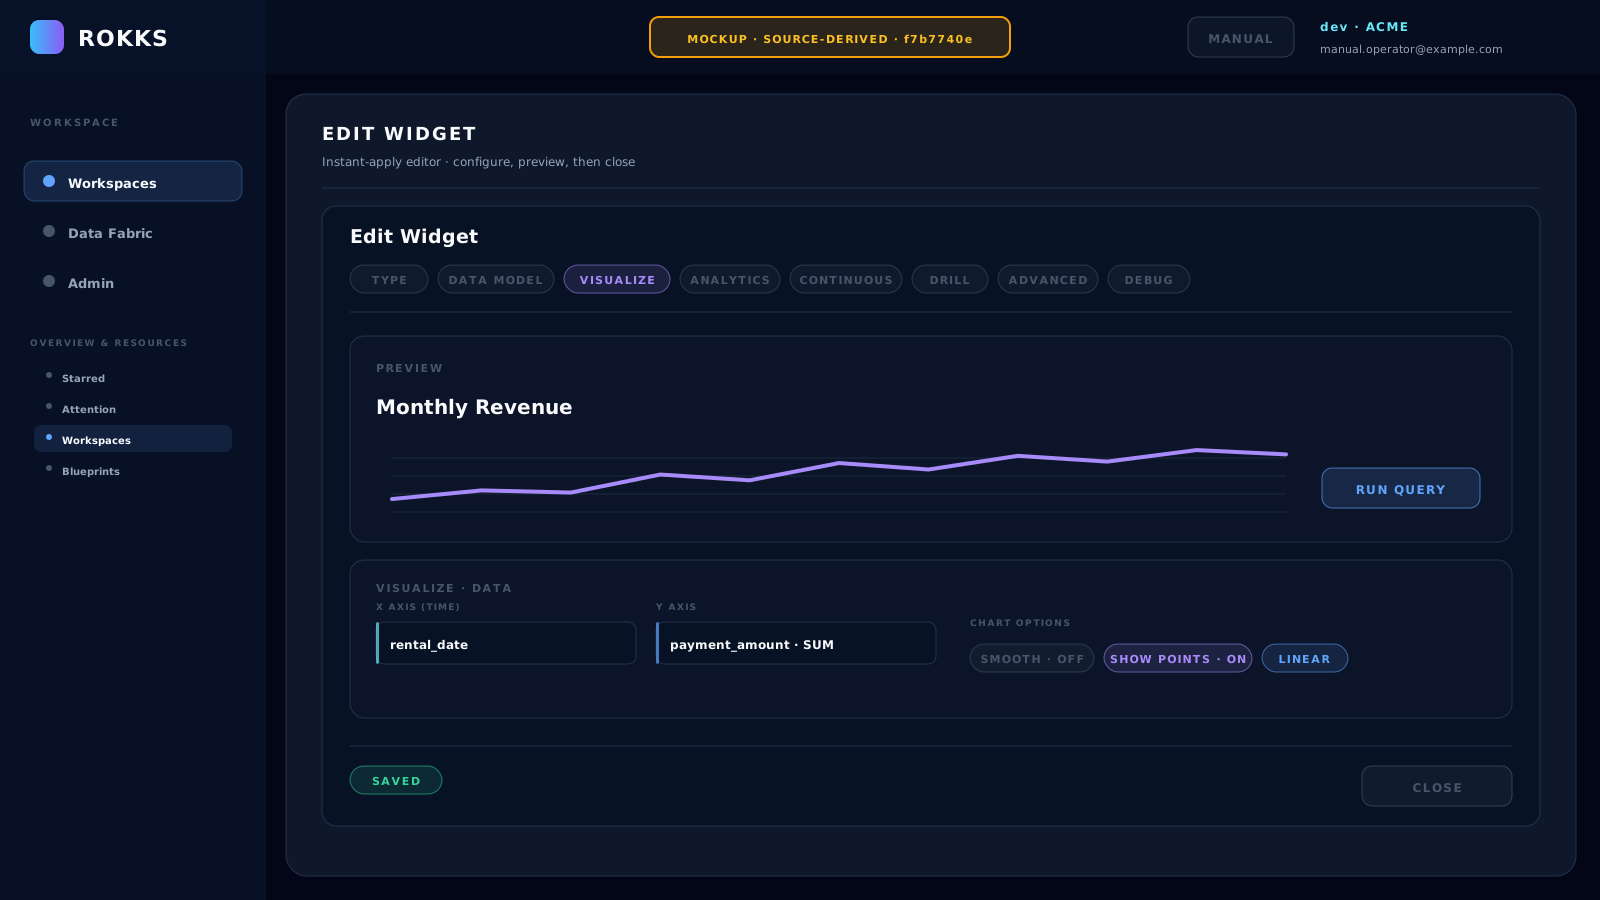
"payments"."payment_date"to X Axis (time),"payments"."amount"to Y Axis 1, and aggregation to SUM. - Select Custom in the title controls and enter Monthly Revenue.
- Click Run Query and inspect Preview. Resolve any error, wait for the save state to settle, then click Close. The instant-apply editor adds the widget on its first successful save and recompiles it in the background.
- In the dashboard toolbar’s Resolution menu, select 1mo — 1 month. In the documented build, known product issue 1374 can make this selection render an unnecessarily fine grain. If the chart becomes dense, return to Auto and continue; the source values and the other widgets remain usable.
MOCKUP — verified Pagila capture pending. This source-derived asset illustrates a Pagila-specific Widget Builder layout. Follow the qualified
"payments"."amount"and"payments"."payment_date"mapping above. The real product editor is pictured in the Widget Builder guide.
Verified intermediate dashboard
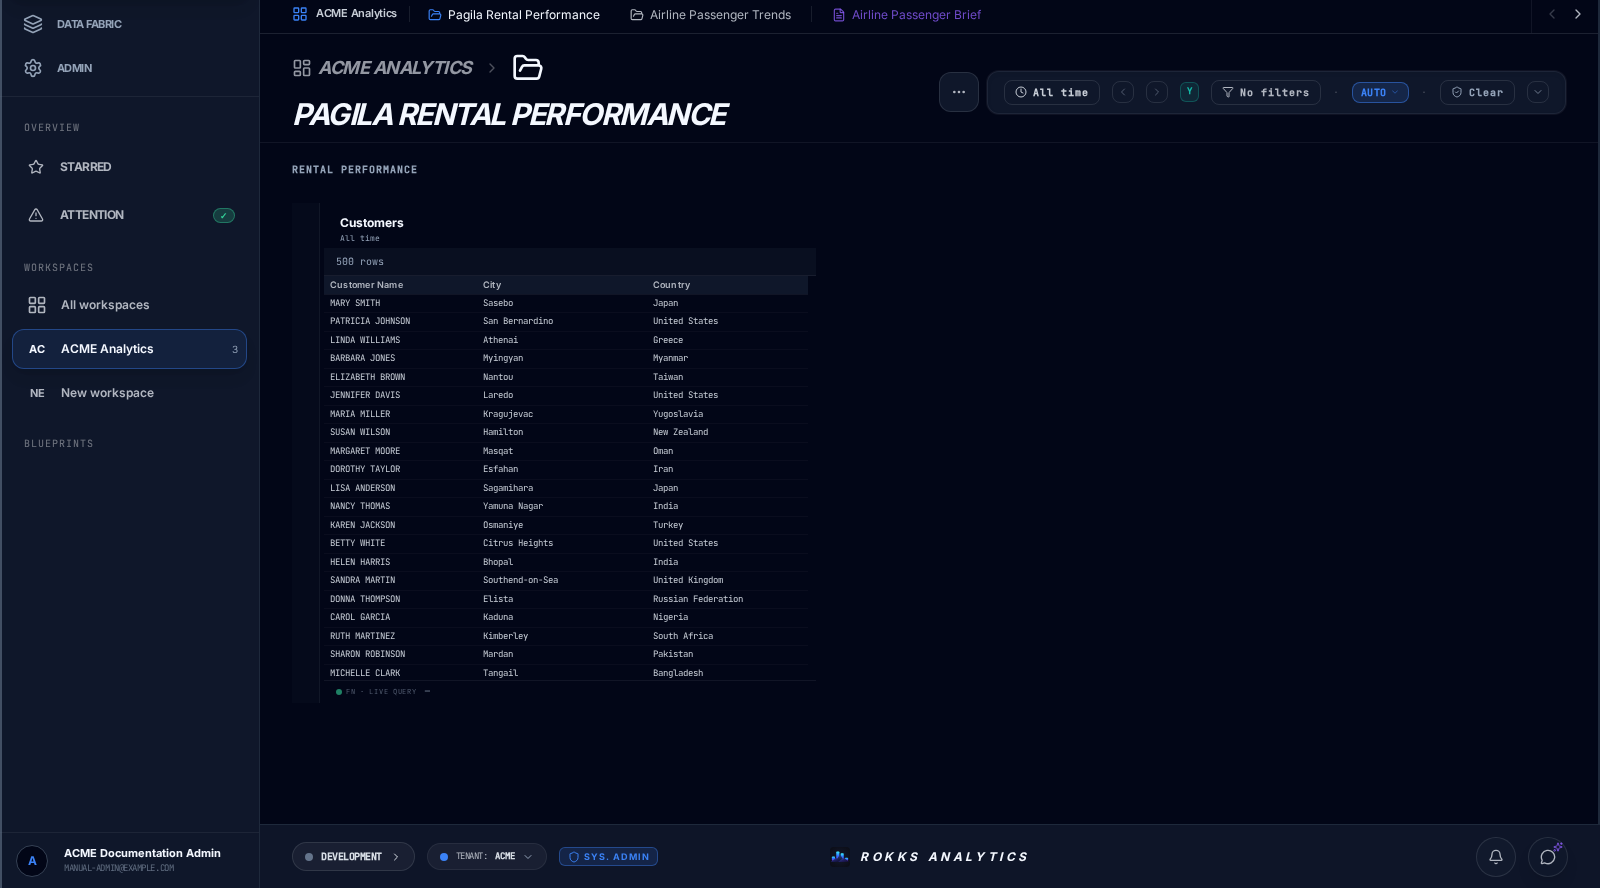
Section titled “Verified intermediate dashboard”Before building the aggregate widgets, you can prove that the dashboard can query
one governed output table. Add a Data Table, anchor it on Customers, and add
customer_name, city, and country to the presentation fields. The real beta
capture below shows that checkpoint with a compiled live query. Its 500 rows
label is the widget preview limit; the loaded Customers output still contains the
997 rows verified in Step 3.
Return to Edit Layout when the table renders, then continue with the aggregate starter dashboard below.
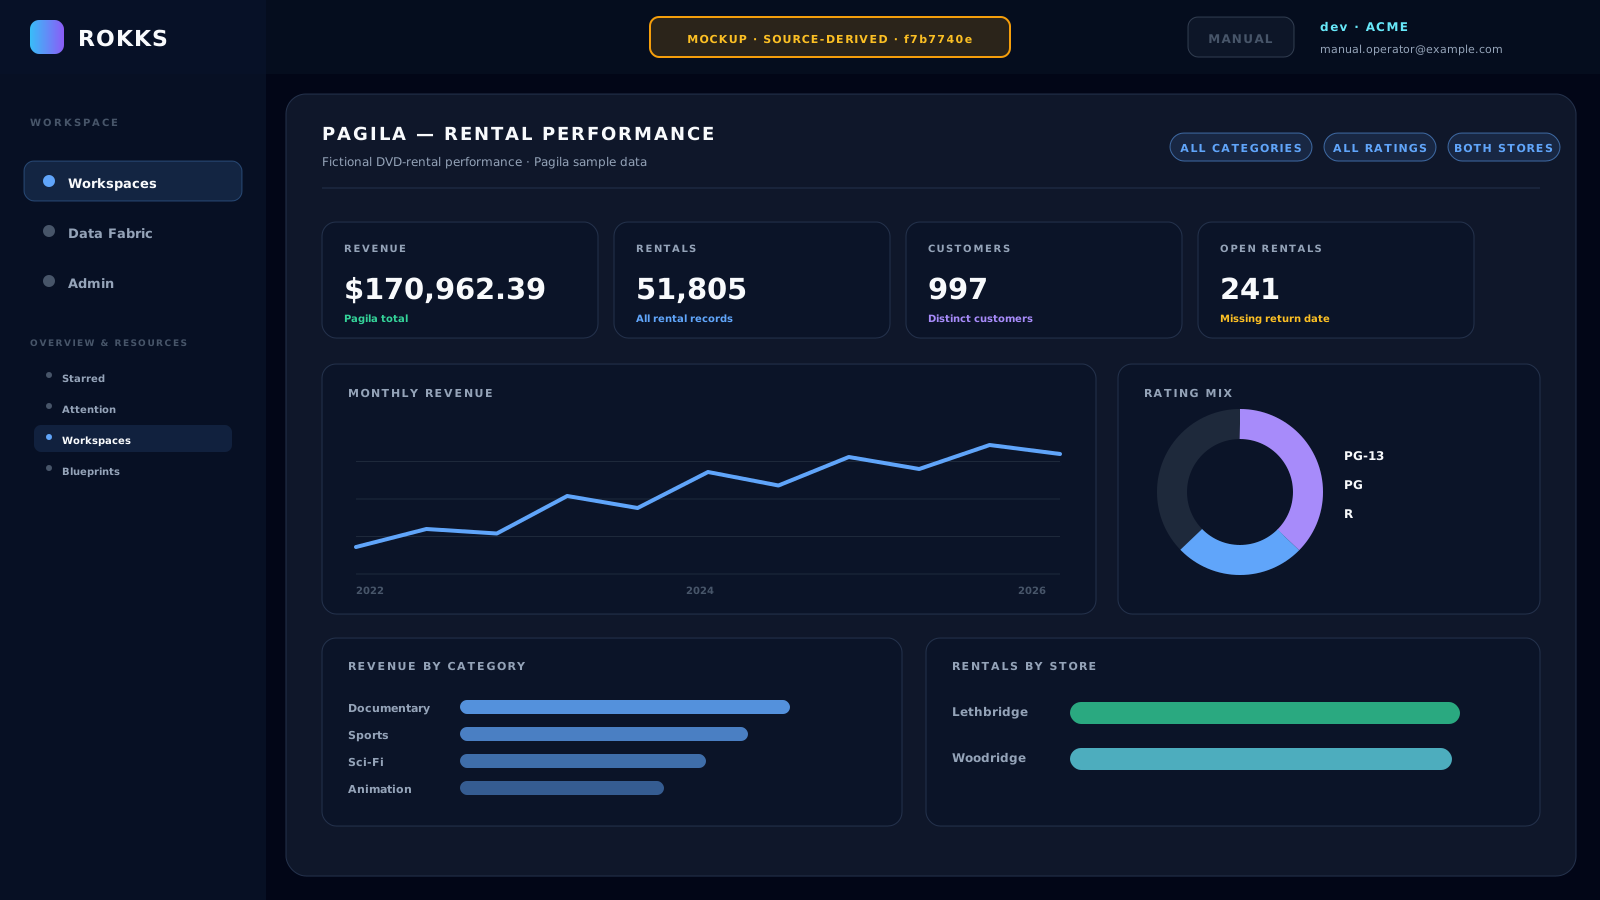
Build this eight-widget starter dashboard:
Use the catalog relationship payments.rental_id → rentals.rental_id whenever a
widget combines payment measures with rental, film, category, or store fields.
Continue through the declared rental relationships rather than matching
similarly named fields by sight.
| Widget | Qualified fields and relationship path | Definition |
|---|---|---|
| Revenue | "payments"."amount" |
SUM("payments"."amount") |
| Rentals | "rentals"."rental_id" |
Count rentals |
| Average Rental Hours | "rentals"."rental_hours_h" |
Average returned-rental duration in hours |
| Customers | "rentals"."customer_id" |
Distinct count |
| Customer Directory | "customers"."customer_name", "customers"."city", "customers"."country" |
Data table of customer locations |
| Monthly Revenue | "payments"."amount", "payments"."payment_date" |
Sum revenue by payment month |
| Revenue by Category | payments.rental_id → rentals.rental_id; rentals.film_id → films.film_id; "films"."category_name" |
Sum "payments"."amount" by film category |
| Revenue by Store | payments.rental_id → rentals.rental_id; rentals.store_id → stores.store_id; "stores"."city" |
Sum "payments"."amount" by store city |
Run each query in Preview, then close one configured widget at a time. This makes an incorrect field or aggregation easy to isolate.
MOCKUP — verified capture pending. This source-derived asset is a proposed dashboard layout, not a captured product state. Use only the fixture-certified values below for acceptance.
Step 5: Exercise a dashboard filter
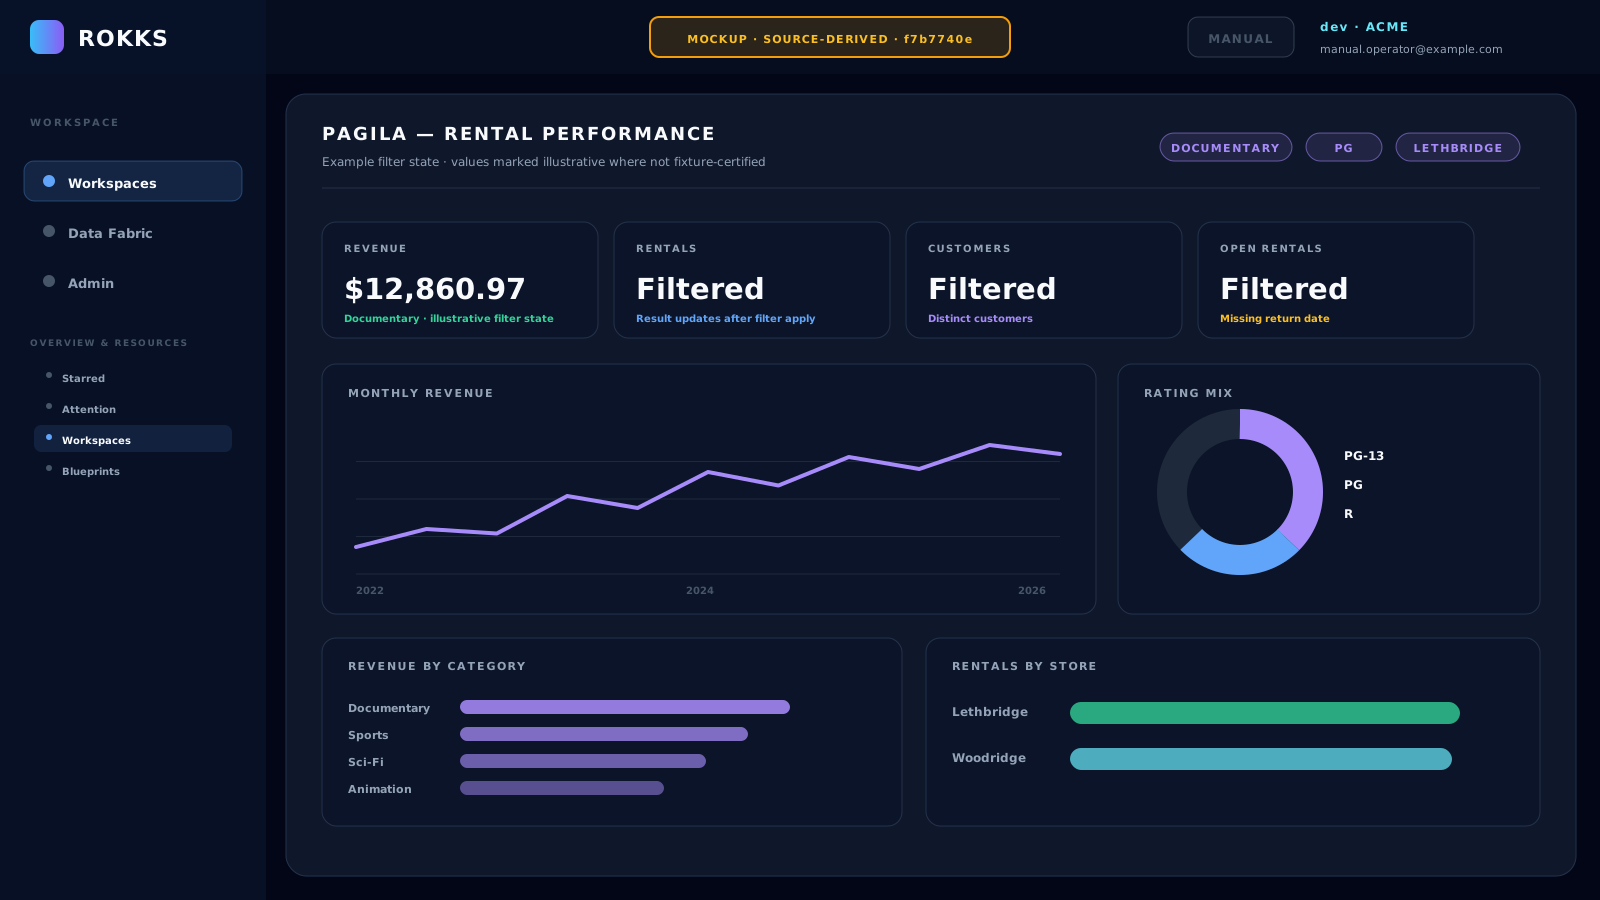
Section titled “Step 5: Exercise a dashboard filter”Click Add or remove filter dimensions and add "films"."category_name", "films"."rating", and "stores"."city" in Filter Dimensions. Close the picker and wait for recompilation. Open the "films"."category_name" chip and select Documentary. With no other filters active, the Revenue result should be 12,860.97 USD. Click Clear all and confirm that the all-data values return.
You can then explore "films"."rating" and "stores"."city", but treat combinations of multiple filters as exploratory until you verify their results against the loaded tables.
MOCKUP — verified capture pending. This source-derived asset deliberately shows an illustrative multi-filter state. Its own label identifies it as a mockup, and its combined-filter values are not acceptance figures.
Expected results
Section titled “Expected results”Use these fixture-certified values for acceptance:
| Check | Expected result |
|---|---|
| Constellation relationships | 5 |
| Categories rows | 16 |
| Stores rows | 2 |
| Customers rows | 997 |
| Films rows | 958 |
| Rentals rows | 51,805 |
| Payments rows | 51,056 |
| First rental timestamp | 2022-02-14 15:16:03+00 |
| Last rental timestamp | 2026-07-28 22:25:29.109854+00 |
| Distinct films | 958 |
| Distinct customers | 997 |
| Film categories | 16 |
| Stores | 2 |
Open rentals (return_date empty) |
241 |
| Total revenue | 170,962.39 USD |
| Highest-revenue category | Documentary — 12,860.97 USD |
| Rentals for Store 1 | 25,761 |
| Rentals for Store 2 | 26,044 |
These aggregate checks are recomputed from the JSON tables through the five declared relationships. The JSON generator aggregates payments by rental_id, keeps the earliest matching payment_date, and omits the 749 rentals that have no payment from the payments table. The flat derivation records those same rentals as 0.00 with an empty payment date. Both fixtures calculate rental_hours for returned rentals and leave that field empty for open rentals.
Generic CSV practice
Section titled “Generic CSV practice”Use CSV to Dashboard when you specifically want to practice the regular-file Source → Sample → Plan → Load lifecycle with pagila-rental-facts.csv. That tutorial is separate from the Constellation acceptance path above.
Every image in this manual carries its own rendered provenance label. Read BETA PRODUCT, LIVE PRODUCT, MOCKUP, or CONCEPTUAL ILLUSTRATION on the individual asset instead of inferring provenance from a page-wide statement. The fixture totals above come from the pinned public JSON and its deterministic derivation records, not from image pixels.
Common mistakes
Section titled “Common mistakes”- Do not upload confidential data for this exercise. Use the supplied public Pagila fixture.
- Do not describe the six-table Constellation as the full Pagila schema. It is a reduced relational projection with complete rental and derived payment facts for this fixture.
- Do not look for imported Constellation tables under Local Tables. Inspect them from the File Areas Output tables list, Analytic Warehouse, or a catalog-backed editor.
- Do not confuse a document-field size policy with the file upload maximum. The source lives in blob storage and must fit the separately configured upload limit.
- Do not treat
AREA_ETL_SYNCDONE as proof that its child load succeeded. Require childFILE_ETLDONE and 6/6 loaded. - Do not mark
rentals.return_dateorrentals.rental_hoursas required. Both are empty for the 241 open rentals;payments.payment_dateis populated on every payment row because unpaid rentals are omitted from that table. - Do not compare a multiply filtered mockup with an all-category certified total. Clear unrelated filters before checking Documentary revenue.
- Do not create several widgets before testing the first query. Verify Monthly Revenue first, then add one widget at a time.
Attribution and license
Section titled “Attribution and license”Pagila © Devrim Gündüz. Pagila originated as a PostgreSQL port of the Sakila sample database, initially developed by Mike Hillyer. The pinned upstream is pagila-v4.0.0 at commit 481abd8fd518fec9abeba14db9ed1a2895c9bd33, distributed under the MIT License.