
Mobile Dashboards
Overview
Section titled “Overview”Mobile dashboards let you inspect operational information without opening the full desktop app. Use them for monitoring, review, and lightweight investigation.
How it works
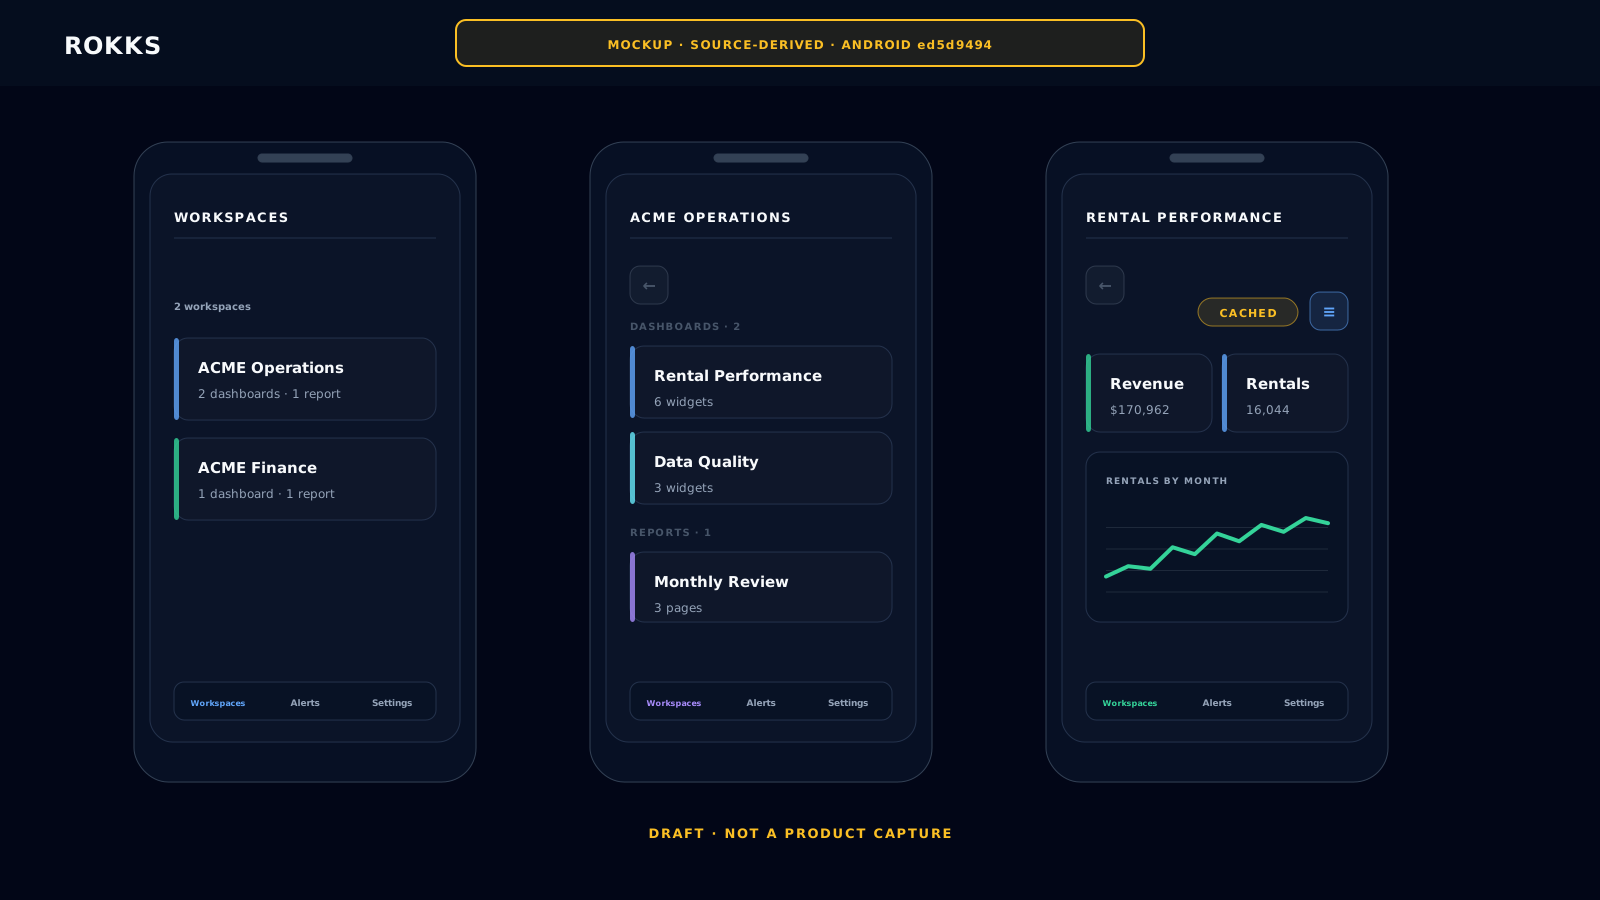
Section titled “How it works”The Workspaces tab lists workspaces available in the selected environment and tenant. A workspace opens its Dashboards and Reports sections. Opening a dashboard fetches a rendered payload from the platform and displays supported widgets as native mobile cards. Tables, KPI cards, charts, gauges, maps, and ECharts-backed visuals can be represented when the dashboard data supports them.
The app can show cached dashboard content when a recent rendered dashboard exists and loading the live result fails. Cached content is marked Cached so users understand that it may be stale. Filter and time controls appear when the dashboard exposes them.
Step-by-step
Section titled “Step-by-step”- Open the Android app.
- Confirm the active environment and tenant.
- Open the Workspaces tab.
- Select a workspace.
- Under Dashboards, tap the dashboard you want to inspect.
- Use available filters or time controls when the dashboard exposes them.
- Return to the workspace with the back action; return again for the workspace list.
Common mistakes
Section titled “Common mistakes”Do not use cached mobile data as proof that a live source is healthy. If a value matters operationally, reopen it with connectivity and make sure the Cached indicator is absent.
Do not expect every desktop-only layout affordance to be available on a phone. The mobile view optimizes the same information for smaller screens.