
Platform Overview
Overview
Section titled “Overview”Rokks connects data sources, transforms them into governed tables, and presents them as dashboards, alerts, and reusable analytical workflows. Users work in the browser. Integrators operate the platform through documented deployment, authentication, scoping, API, and job concepts.
How it works
Section titled “How it works”flowchart LR SourceData["Source data"] --> DataFabric["Data Fabric"] DataFabric --> Warehouse["Analytical warehouse"] Warehouse --> Dashboards["Dashboards"] Warehouse --> Alerts["Alerts"] Dashboards --> Decisions["Operational decisions"]The Data Fabric is where data enters the system. A source can be a file, a web endpoint, an application connector, or an existing database table. Rokks profiles the source, lets you define or review metadata, and loads the result into a governed analytical layer.
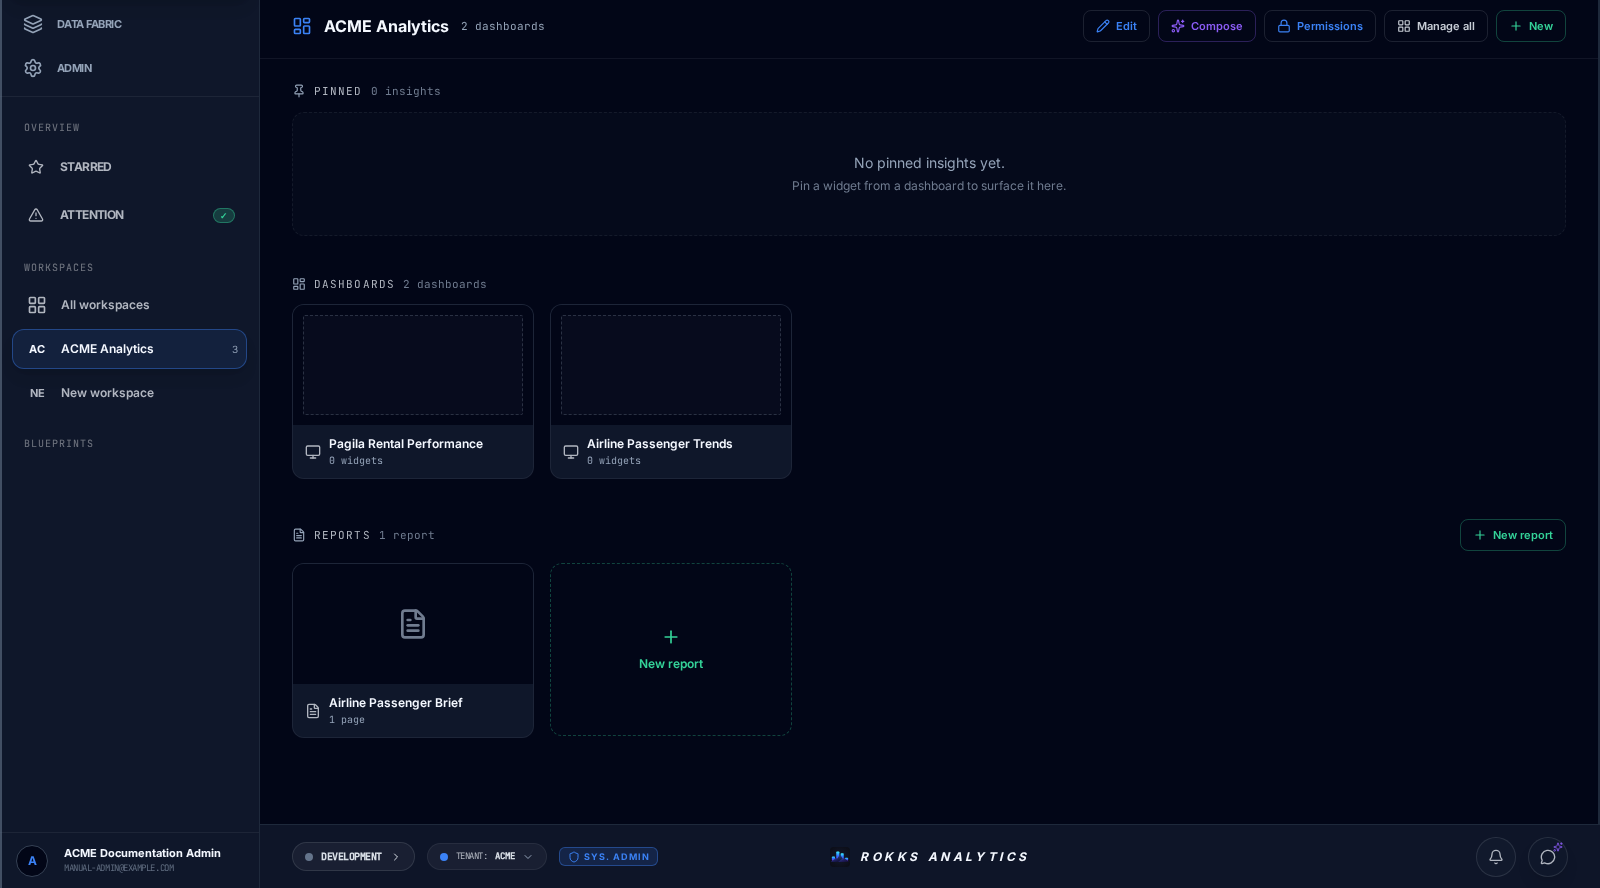
Dashboards are the primary user-facing output. A dashboard can contain charts, tables, scorecards, maps, and other widgets. The Widget Builder helps users select data, choose fields, apply filters, preview results, wait for the instant save, and close the editor without writing code.
The operations area keeps long-running work visible. Jobs, alert evaluations, tenant operations, and service health checks are tracked so users do not have to guess whether the platform is still working.
The Android app is the mobile companion for read-focused work. It lets users view dashboards, review alert events, and manage mobile session settings while heavier authoring and administration stays in the web app.
Step-by-step
Section titled “Step-by-step”- Choose the active environment and tenant.
- Bring data into the Data Fabric.
- Review the generated schema and metadata.
- Build a dashboard from the loaded data.
- Monitor jobs and alerts after the workflow is running.
Common mistakes
Section titled “Common mistakes”The most common mistake is treating a dashboard widget as the source of truth. Widgets are views over governed data. Fix source data, metadata, schedules, and filters in the relevant Data Fabric or operations page, then let dashboards update from that source.
Another common mistake is switching environments without checking the tenant selector. Environment and tenant together define the scope of data, jobs, dashboards, and configuration.